Infographics and maps
Complex content presented simply and clearly.
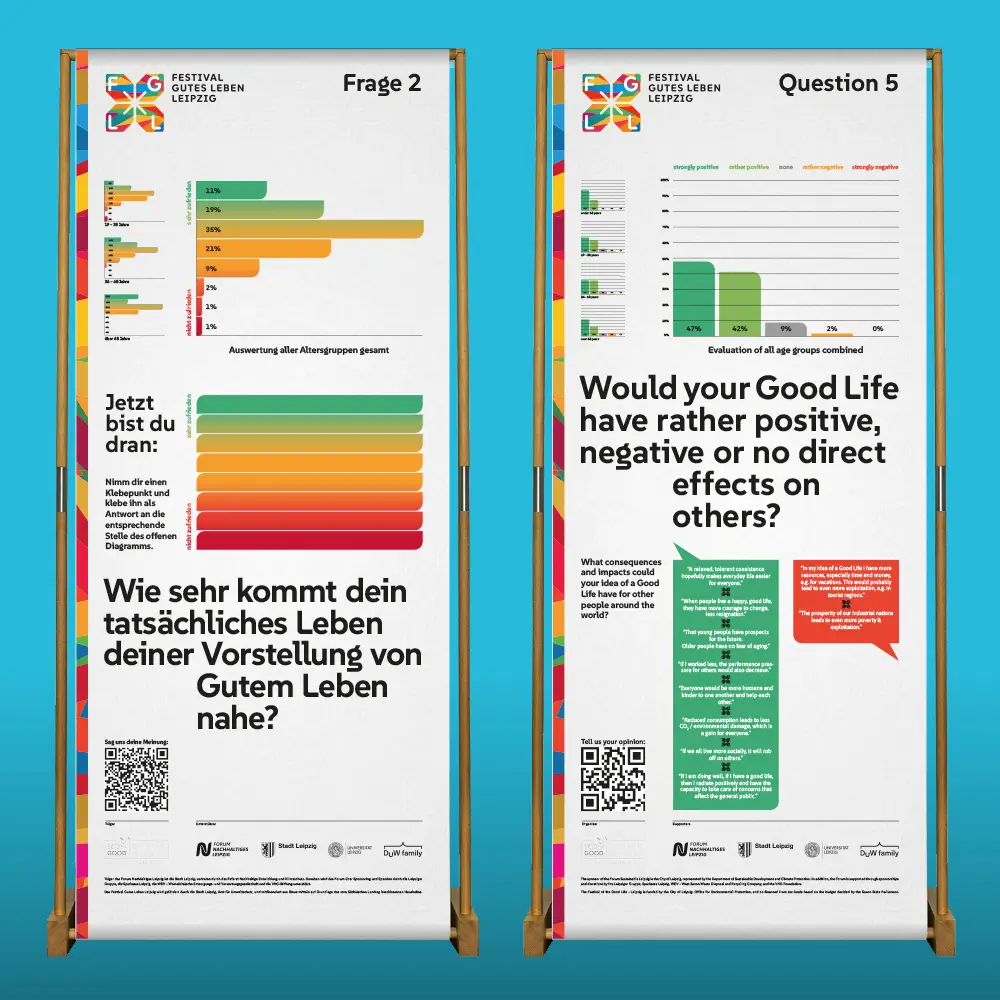
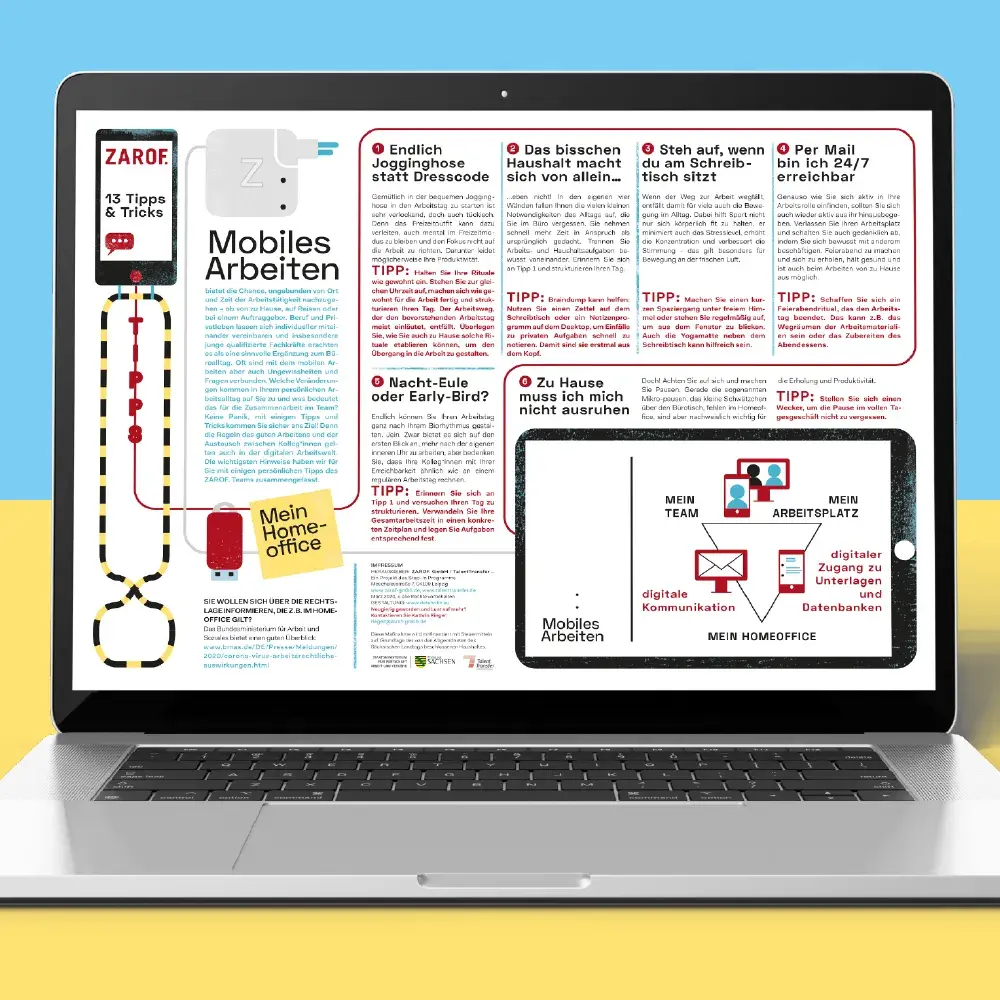
Whether maps, plans, or data visualizations – we develop infographics that clearly structure information and make it visually engaging. Our design range extends from factual presentations and illustrative maps to pictographic systems and comprehensive text presentations – for print, digital media, or interactive applications.
Diversity in the implementation of infographics
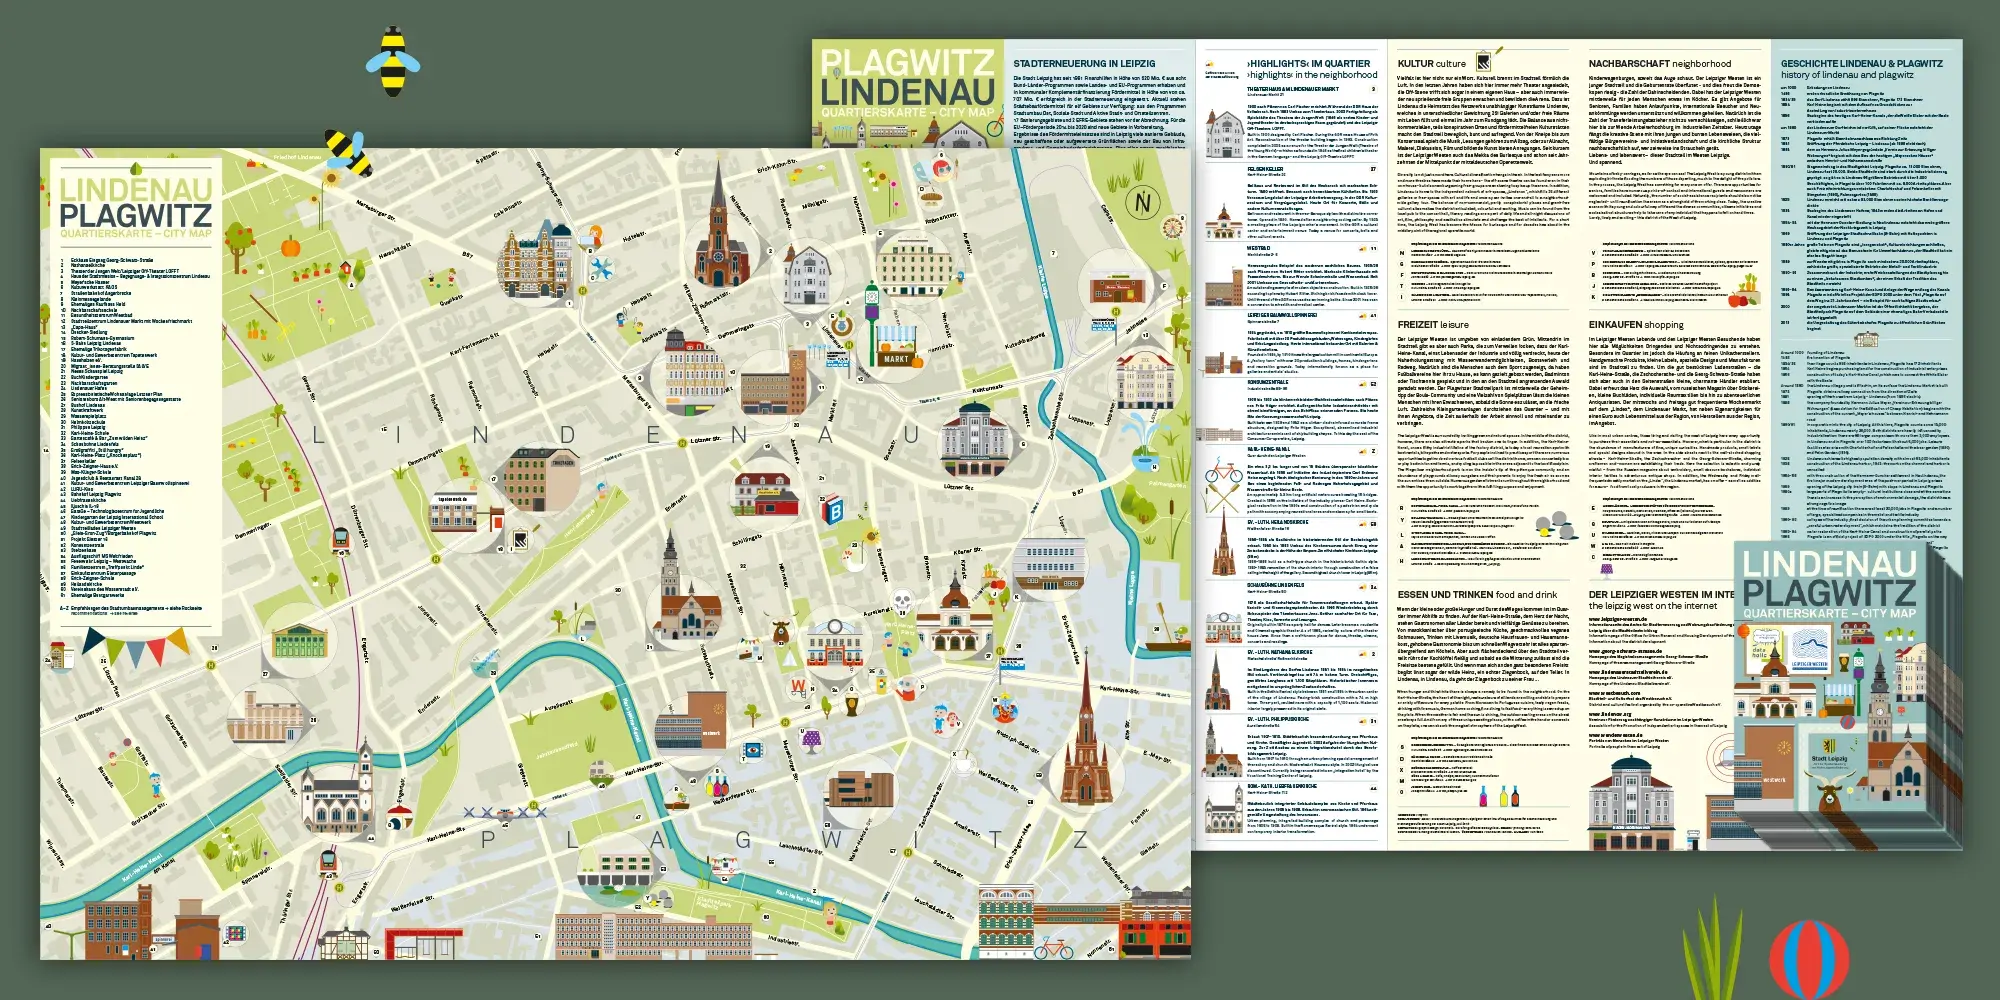
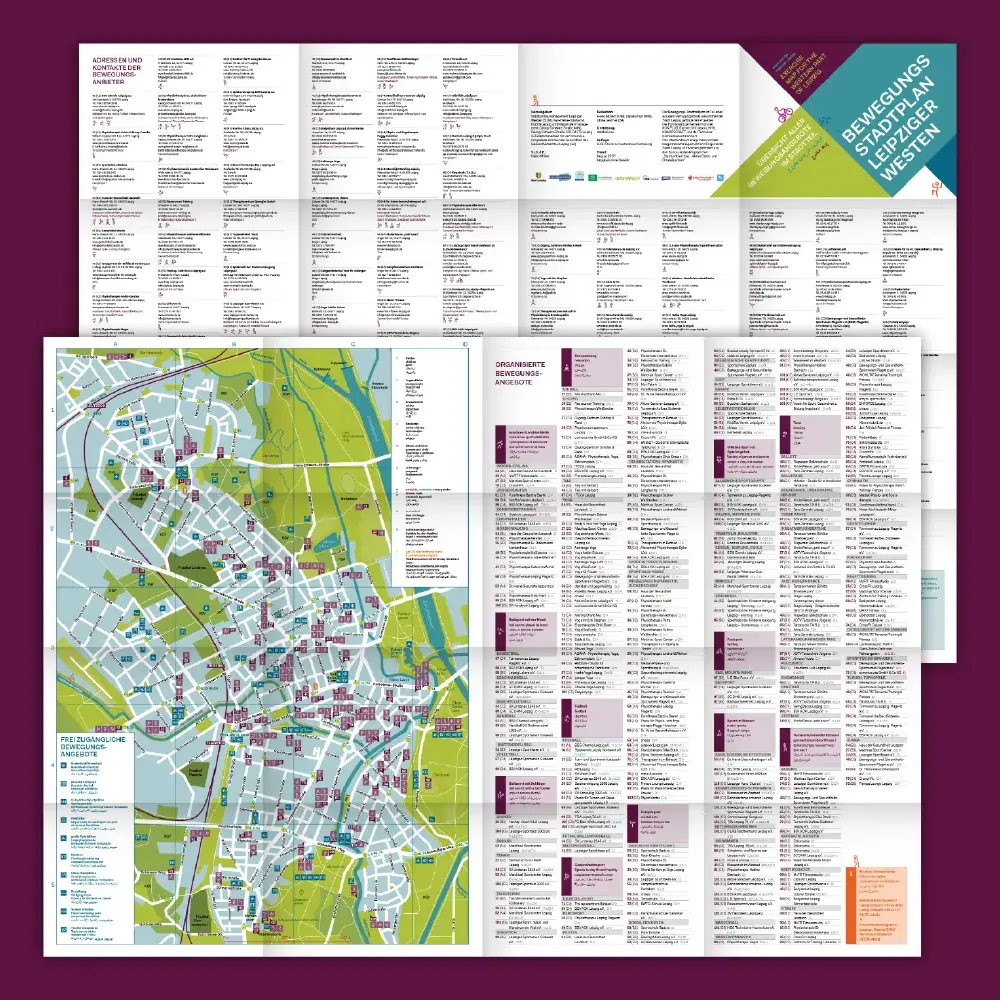
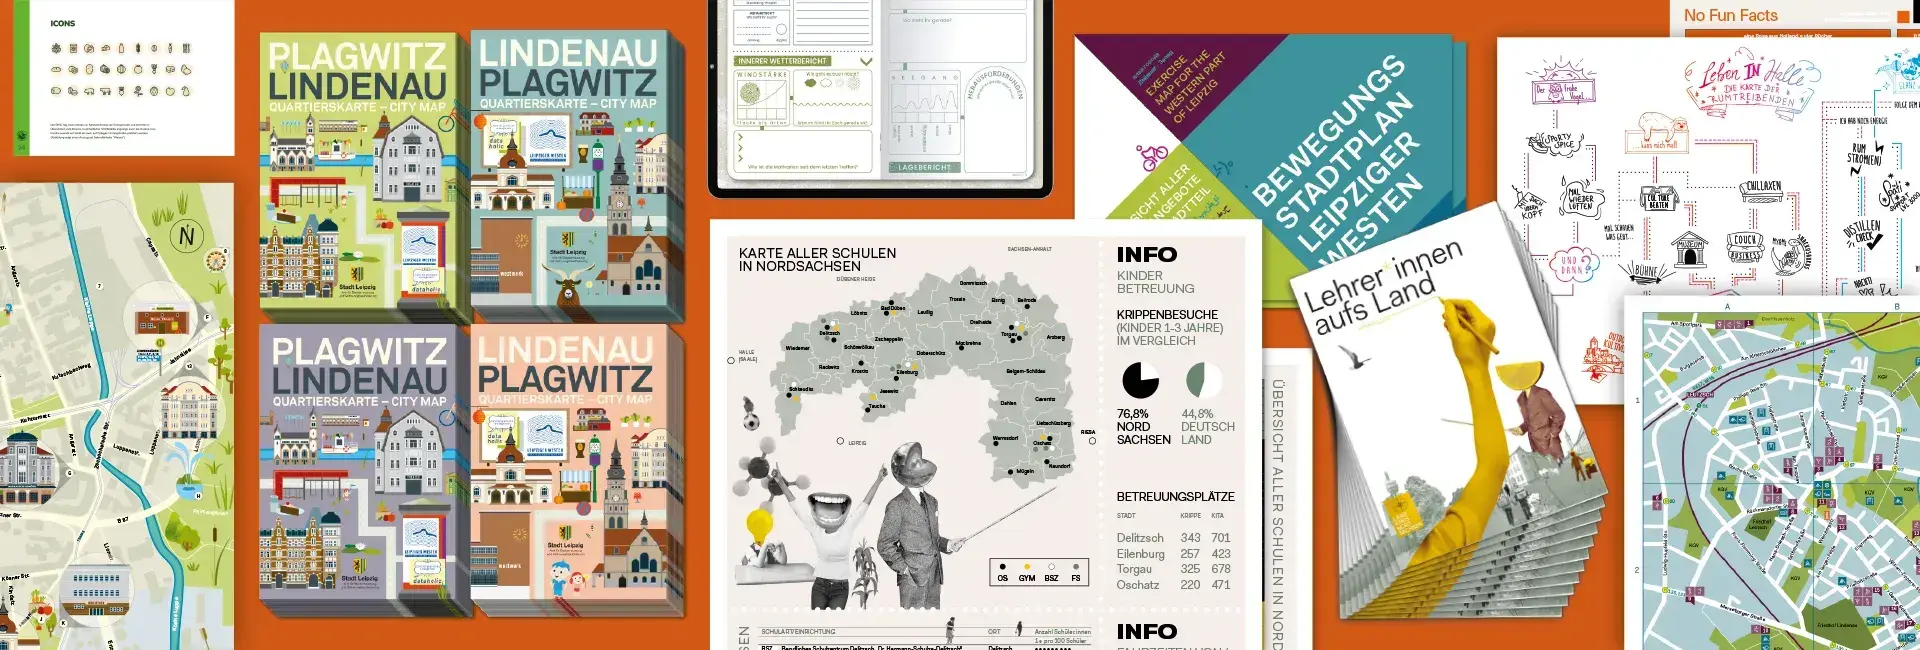
For the "Stadtteilbüro Leipziger Westen" City maps were created that, in addition to providing orientation, also visualize life in the neighborhood through detailed illustrations and "house portraits." The Leipzig city activity map shows sports facilities in western Leipzig, organized using specially developed pictograms.
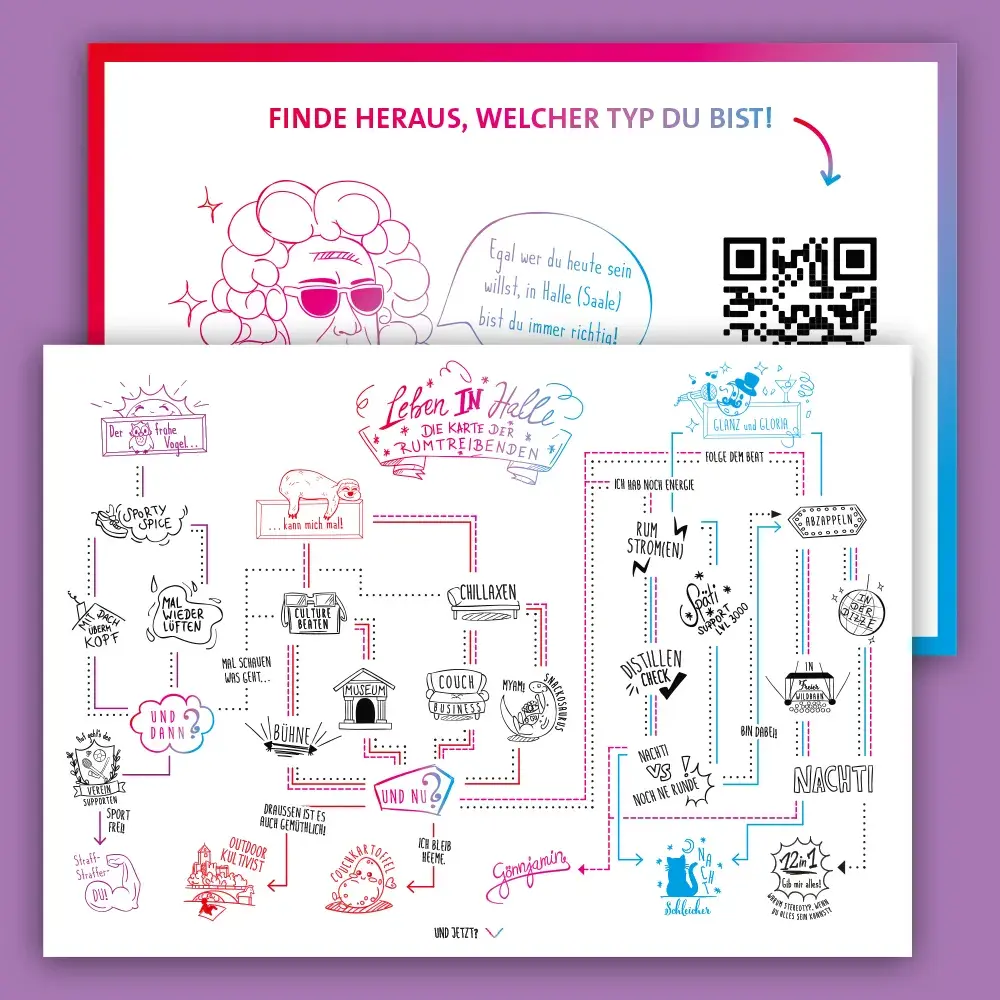
For the "Stadtmarketing Halle" an illustrated decision tree – the „Map of the Wanderers“ – was created, with each icon individually designed and vectorized. The result is a postcard and an interactive PWA that users can click through.
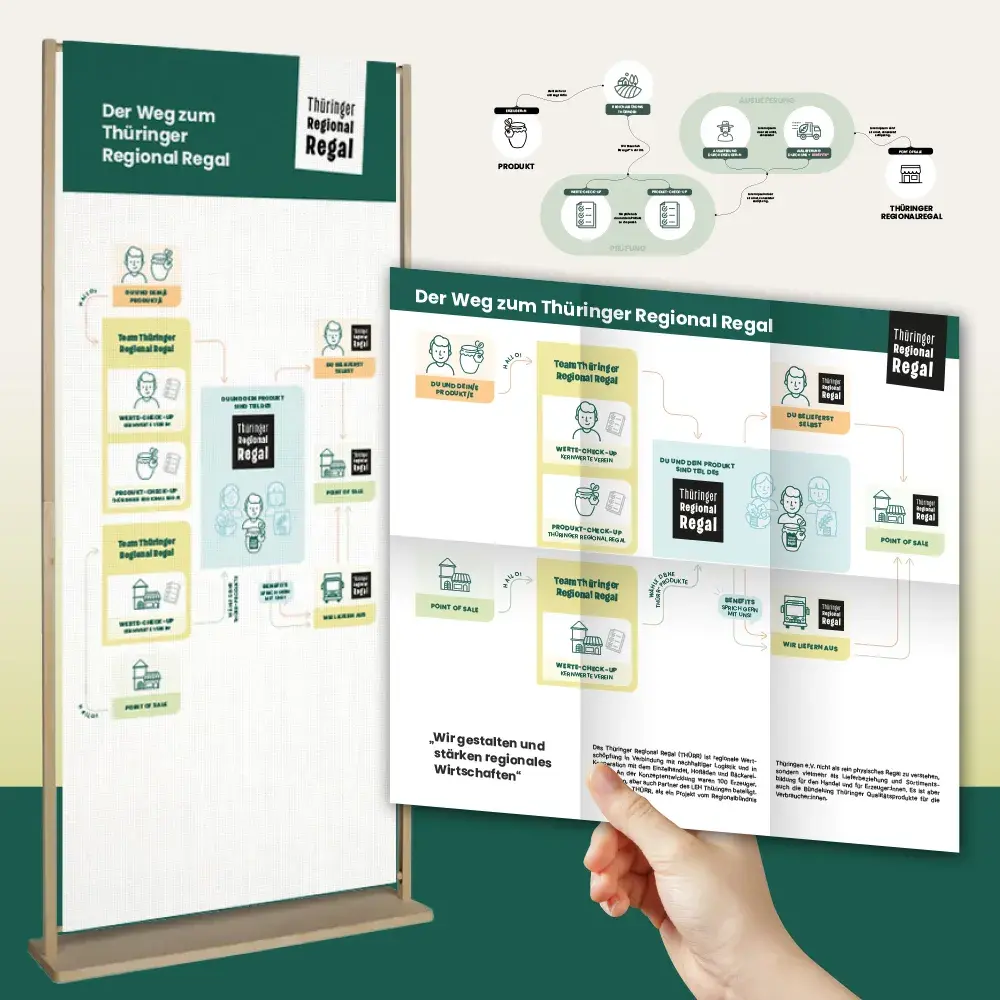
At the "Regionalbündnis Thüringen" an illustrated organizational chart for product placement and a process graphic complement the external presentation and facilitate the overview of complex processes.
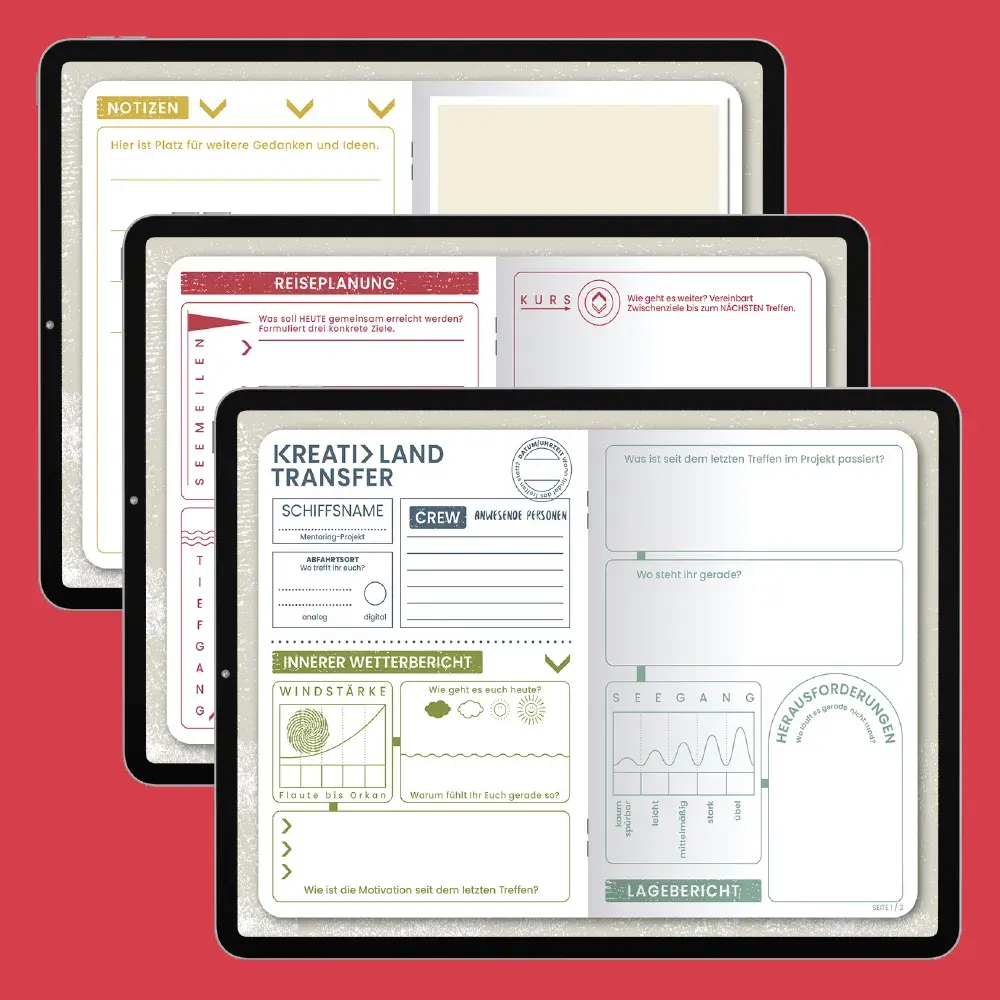
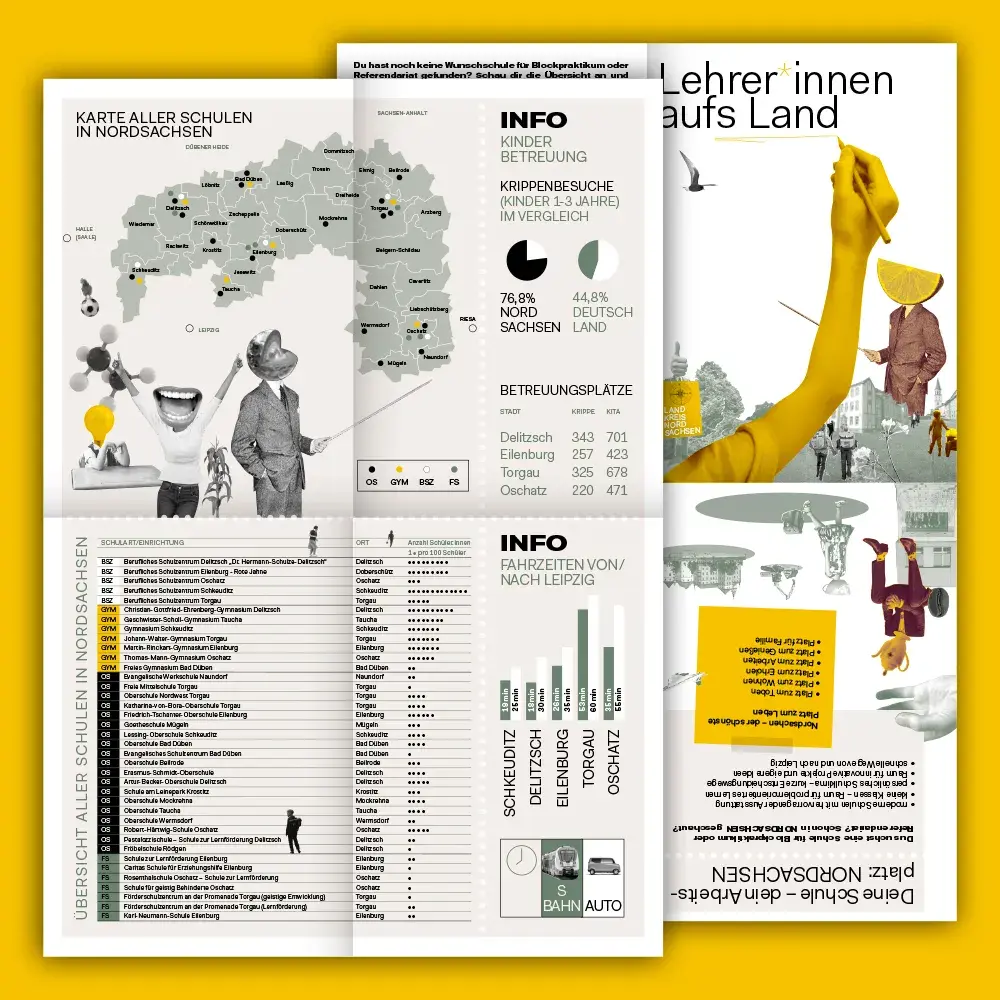
This also includes the graphic design of projects such as "Lehrer*innen aufs Land" – with humorous collage elements – or the development of key visuals and digital checklists for "KreativLandTransfer" demonstrates the diversity of our approaches: always adapted to content, target group and medium.
Services at a glance
- Infographics for print and digital media: Whether structured data visualizations, vibrant illustrations or the integration of large amounts of text – each infographic is individually tailored to the medium, content and intended use.
- Design of maps and plans: Neighborhood maps, movement maps or special topic maps are supplemented by detailed illustrations and pictograms to promote orientation and comprehensibility.
- Interactive and digital formats: Infographics are also created as interactive elements, for example in checklists or digital tools.
The result
Infographics that make knowledge visible, convey content vividly and provide orientation – clearly structured, individually designed and implemented to fit perfectly.
Your contact person:

Services: